

An “out of GPU memory” crash does not automatically mean you need a new graphics card. This practical workflow helps architects identify what is filling VRAM, recover memory safely, and decide when optimization has reached its limit.

The failure rarely begins with a clear message. A Lumion scene may become increasingly difficult to navigate. D5 Render may stutter after vegetation is added. Enscape can disable a ray-traced effect, while V-Ray GPU or Blender may fail only when the final image starts. The project looked fine yesterday, so the instinct is to blame a driver or buy a larger GPU.
Sometimes the graphics card is genuinely too small. Just as often, the last change exposed inefficient geometry, oversized textures, duplicated assets, an unnecessarily large output or another application consuming the same memory. The correct response is diagnosis first, optimization second and hardware replacement last.
What “out of GPU memory” actually means
VRAM is the GPU’s local working space. During architectural visualization it can contain geometry, instances, texture maps, ray-tracing acceleration structures, shadows, reflections, denoising data and image buffers. The renderer also needs memory for its own interface and background processes. Browsers, Photoshop, local AI tools, video software and additional GPU-accelerated design applications may compete for the same pool.
Project file size is not a dependable VRAM estimate. A compressed texture expands when decoded. Displacement can create far more geometry at render time. A forest made from true instances may be efficient, while visually identical trees converted into unique meshes can be expensive. Final output can also fail even when the viewport is stable because high-resolution buffers are allocated only during export.

Diagnose the failure before editing the scene
1. Reproduce one specific failure
Choose the smallest reliable test: the camera that stutters, the effect that switches off or the export that fails. Do not test by wandering around the scene. A repeatable view gives you a baseline for every change.
2. Watch dedicated GPU memory
On Windows, open Task Manager, select Performance and watch dedicated GPU memory while loading the project and running the test. Vendor monitoring tools can provide more detail, but the simple graph is enough to distinguish a near-capacity problem from a crash that occurs with plenty of free memory. If VRAM remains well below its limit, investigate drivers, corrupt assets, software updates, temperatures and power stability instead of deleting scene content blindly.
3. Establish the last known-good state
List what changed immediately before the problem: imported BIM revision, vegetation pass, new material library, higher render resolution, ray tracing, a second application or a driver update. Temporarily disable only that group. If the failure disappears, subdivide the group until the costly asset or setting becomes clear.
4. Separate viewport pressure from export pressure
If editing is slow at every camera, geometry and asset load are likely involved. If only one high-resolution export fails, output buffers, denoising or the chosen effect may be the trigger. Test the same camera at half the width and height. That reduces the pixel count to one quarter and quickly shows whether resolution is central to the problem.
| Symptom | Likely direction | First controlled test |
|---|---|---|
| Viewport slows after an import | Unique geometry, tessellation or oversized BIM scope | Hide the new import or use a section/export set. |
| Scene slows after landscaping | Unique vegetation, excessive variation or heavy assets | Replace one group with native instances/proxies. |
| Only final render fails | Output resolution, render buffers or ray-traced effects | Render the same view at 50% dimensions. |
| Memory is high before opening the renderer | Other GPU applications | Close browsers, AI tools and secondary renderers. |
| Crash occurs with VRAM available | Driver, bad asset, software defect, heat or power | Test a clean scene and the vendor-recommended driver. |
How Lumion, D5, Enscape, V-Ray and Blender differ
Official requirements describe different memory behavior. Lumion identifies the graphics card as its most important component and explains that additional graphics memory allows more detail, textures and models to be loaded. D5 Render similarly emphasizes that VRAM affects complex-scene handling and requires a compatible ray-tracing-ready GPU.
Chaos lists 4GB as Enscape’s minimum, 8GB as recommended and 12GB for VR in its current requirements. Its performance guidance notes that ray-traced sun shadows are GPU-memory intensive and may be disabled automatically when available memory is too low. High-resolution output can also exhaust VRAM even when normal navigation works.
V-Ray GPU is less forgiving because Chaos states that the complete scene—geometry, textures and buffers—must fit into GPU memory in CUDA or RTX mode. CUDA x86 can use system RAM as an alternative, but that is a different performance path. Blender Cycles can use system memory when supported GPU backends fill VRAM, according to the Blender manual, but the fallback has a performance cost.
Official D5 Tutorials video on YouTube
Video source: D5 Tutorials, “Get the Best Out of D5 Render: System Requirements and Recommendations.” Hardware guidance changes; verify the current official specification before purchasing.
Reduce geometry without damaging the design
Start with data that cannot affect the required image. In Revit, use section boxes, view filters and dedicated export views. Exclude hidden disciplines, tiny fasteners, internal services and distant interiors when they do not contribute to the camera. In SketchUp or 3ds Max, inspect imported furniture, curved profiles and scattered objects for extreme polygon counts.
Use renderer-native instances, proxies or optimized library assets for repeated vegetation, furniture and lighting. Instances reuse source data; copied unique meshes may not. Preserve the original high-detail model outside the visualization file and create an intentional presentation model rather than treating every BIM object as render-critical.

Fix textures, vegetation and displacement
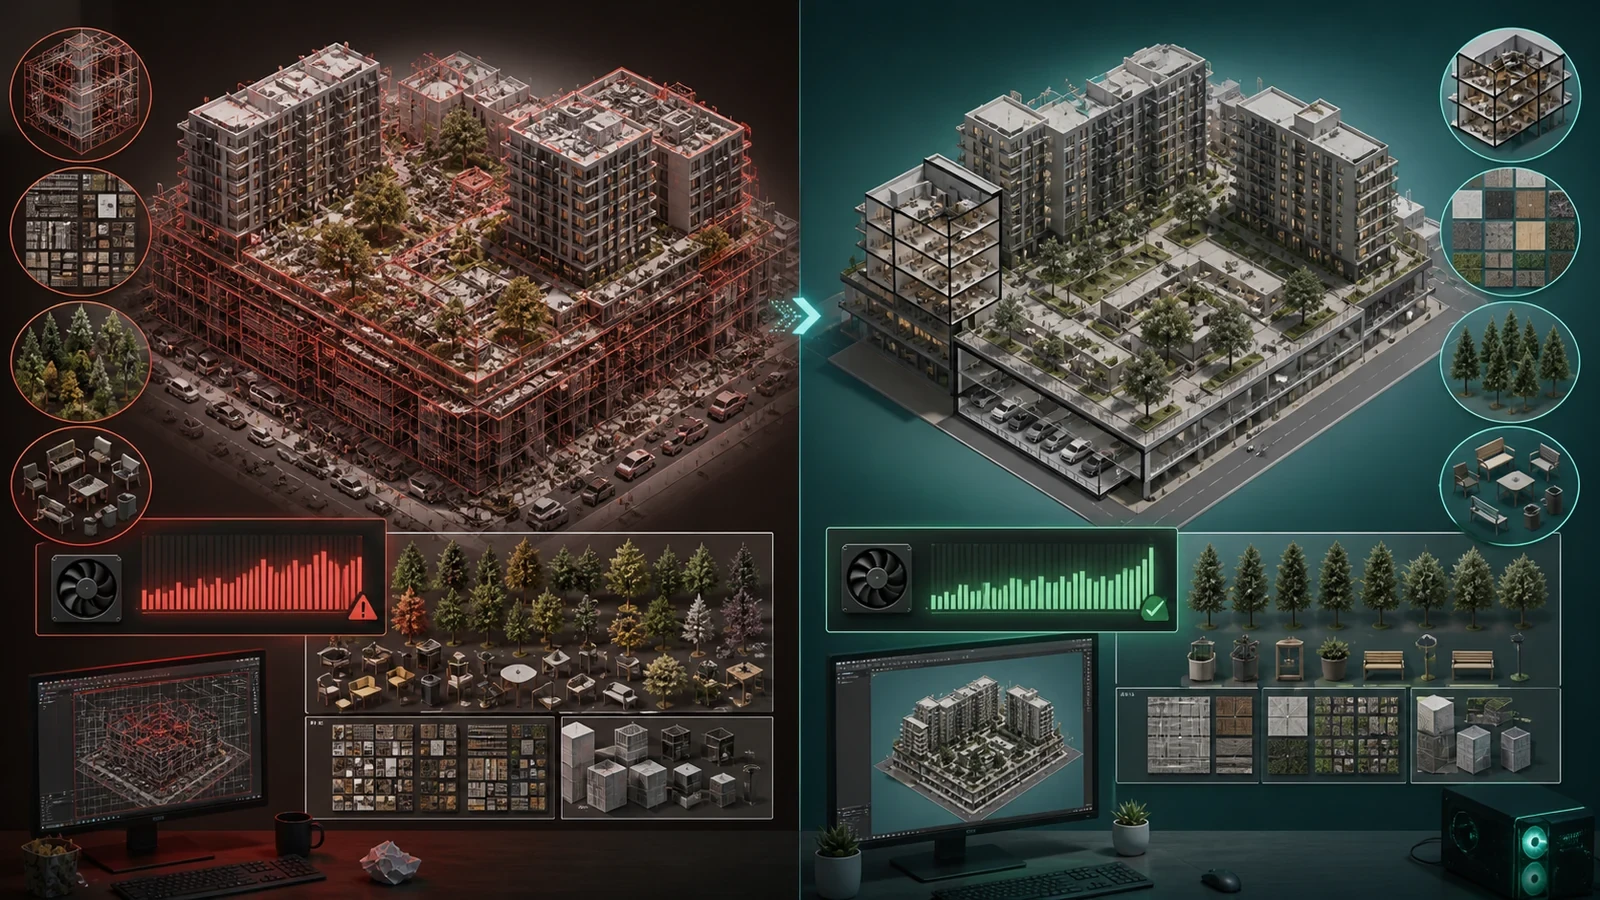
Texture resolution should follow visible pixel size, not the maximum file available. An 8K map on a small background chair contributes almost nothing to the final image. Reserve high-resolution maps for close surfaces, use smaller versions for distant assets and remove unused material slots. Check all channels: base color may be reasonable while normal, roughness and displacement maps remain unnecessarily large.
Vegetation combines geometry, textures and transparency, so it can pressure several systems at once. Use a controlled set of optimized species, instance them and vary scale, rotation and color instead of importing many unique models. Replace foreground assets with lighter variants outside the camera’s focus. Reduce subdivision and displacement where silhouette or close detail does not justify it.
Control output, effects and competing applications
Close hardware-accelerated browsers, image generators, video editors and unused render windows before the final export. Do not assume minimized software releases its memory. Restarting the renderer can also clear memory retained during long editing sessions, but treat that as a diagnostic clue rather than the permanent fix.
Lower editor quality while composing and restore final effects for controlled tests. For a failing export, reduce resolution first, then isolate expensive ray-traced effects, denoising and high-sample settings. Enscape explicitly warns that extreme output resolutions can clog VRAM. In Blender, current performance guidance recommends smaller render tiles and texture caching when memory is limited.
- Save a diagnostic copy and restart the renderer.
- Close browsers, local AI, video and secondary rendering applications.
- Record idle and peak dedicated VRAM.
- Test the same camera at half output dimensions.
- Hide the last imported asset group or BIM revision.
- Replace repeated unique vegetation with instances or proxies.
- Downsize non-critical 4K/8K textures and displacement maps.
- Remove geometry outside the view or required animation path.
- Test the vendor-recommended graphics driver.
- Write down which single change fixed the repeatable failure.
When a GPU upgrade is the correct answer
Optimization has reached its limit when a representative, responsibly built project still approaches full dedicated memory during normal production—not only an exceptional 8K experiment. Measure several real projects. If they repeatedly peak near capacity after sensible cleanup, add working headroom rather than buying exactly enough for today’s scene.
As a practical editorial rule, 8GB remains an entry tier, 12GB is a sensible floor for serious architectural work, 16GB is a balanced professional capacity, and 24GB or more serves dense city scenes, heavy V-Ray GPU production, very high-resolution output and local AI. These are workload bands, not official universal requirements. Our existing 2026 architectural rendering workstation guide covers the wider buying decision, including CPU, RAM, SSD and laptop trade-offs.
Capacity alone does not determine speed. Compare compute performance, bandwidth, application support, power, cooling and laptop wattage. NVIDIA’s current comparison, for example, lists different RTX 50-series cards with 8GB, 12GB, 16GB and 32GB configurations, but cards with the same capacity can perform very differently. Check official software requirements and independent application-specific testing on purchase day.
Frequently asked questions
Why does a render fail when the viewport still works?
Final rendering can allocate larger image, denoising and ray-tracing buffers that are not required during ordinary navigation. Test the same camera at half width and height to see whether output resolution is the trigger.
Will adding system RAM fix an out-of-VRAM error?
Not always. Some renderers can fall back to system RAM or use a CPU mode, but local GPU memory is much faster and several GPU renderers still require the scene to fit in VRAM. More system RAM does not increase dedicated VRAM.
Can two graphics cards combine their memory?
Usually not. Many renderers duplicate scene data on each device, so the smallest card can remain the limit. Chaos documents particular NVLink configurations, but multi-GPU memory behavior must be verified for the exact renderer and GPU generation.
Should I update the driver during a deadline?
Only with a rollback plan. Confirm the renderer’s recommended driver, save work, document the current version and test the problem project after updating. A memory problem that tracks scene complexity is unlikely to disappear through a driver change alone.
- Lumion Support — What kind of computer does Lumion 2026 need?
- D5 Render — System Requirements for D5 Render
- Chaos Documentation — Enscape System Requirements
- Chaos Documentation — Enscape Performance and Memory Considerations
- Chaos Help Center — V-Ray GPU requirements
- Blender Manual — GPU Rendering
- NVIDIA — Compare GeForce graphics card specifications
Continue Exploring